5 Questions to Ask Before Shipping Precision Parts
A 5-question freight risk scorecard for manufacturers shipping precision parts. Assess replaceability, schedule dependency, carrier touches, damage recovery, and notification requirements before choosing a shipping method.

Most freight decisions in manufacturing happen at the shipping dock, not in a planning meeting. A part finishes machining, someone pulls up a rate board, and the shipment moves on whatever carrier offers an acceptable price and a pickup window that fits the production schedule. For routine freight, this works. For precision manufactured parts — custom-machined components, calibrated assemblies, coated or treated surfaces, one-of-one prototypes — this approach is a coin flip dressed up as a logistics process.
The difference between routine freight and precision freight is not the weight on the bill of lading or the dimensions on the packaging spec. It is the cost of failure. A pallet of standard fasteners that arrives a day late is an inconvenience. A custom-machined aerospace bracket that arrives a day late — or arrives damaged — can halt an assembly line, blow an installation window, and trigger a recovery sequence that costs 10 to 30 times the value of the part itself. (For a detailed breakdown of how those costs cascade, see The Real Cost of a Freight Failure in Manufacturing.)
The problem is not that manufacturers make bad freight decisions. The problem is that most manufacturers do not have a repeatable framework for distinguishing between shipments that can tolerate commodity service and shipments that cannot. Every shipment gets evaluated on the same criteria — rate and pickup availability — regardless of the downstream exposure it carries.
The five questions below provide that framework. They take approximately 90 seconds to answer per shipment and produce a risk profile that directly informs mode selection, carrier requirements, and communication planning. Manufacturers who adopt this approach consistently report fewer freight-induced production disruptions, lower emergency expedite spending, and shorter recovery cycles when exceptions do occur.
The 5-Question Freight Risk Scorecard
Question 1: Can This Part Be Remade in Under Two Weeks?
This is the replaceability question, and it is the single most important variable in freight risk assessment for manufactured parts.
If the answer is yes — the part can be reproduced from existing tooling, with available material, within a two-week window — the freight risk is bounded. A failure (late delivery, damage, loss) triggers a rework cycle, but the rework cycle has a known duration and a predictable cost. The manufacturer can quote a recovery timeline to the customer with reasonable confidence. The situation is painful but manageable.
If the answer is no — the part requires specialized tooling that is committed to other jobs, raw material with extended lead times, coating or treatment processes with queue-dependent scheduling, or calibration that depends on specific environmental conditions — the freight risk is fundamentally different. A failure does not initiate a recovery cycle. It initiates a crisis. The replacement timeline is uncertain, the cost is unpredictable, and the downstream impact compounds with every day the recovery takes.
Replaceability is not a binary condition. It operates on a spectrum. A part that can be remade in three days from shelf stock is at one end. A part that requires six weeks of lead time on specialty alloy, four days of five-axis machining, and a two-week coating cycle is at the other. The freight decision should reflect where the specific shipment falls on that spectrum.
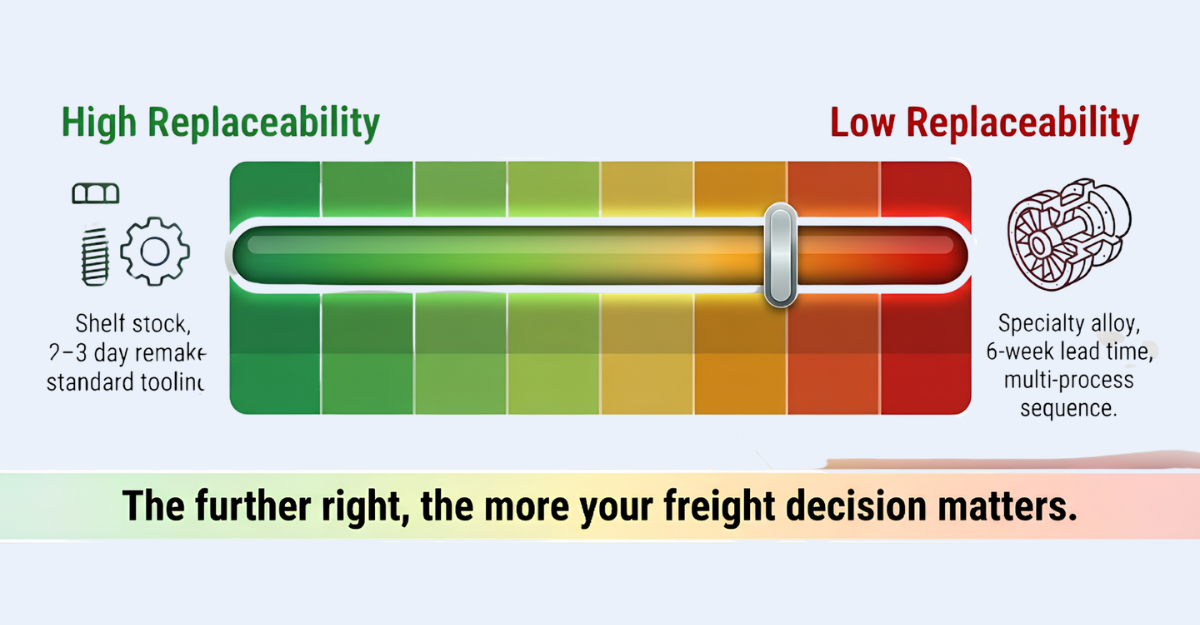
What this means for the freight decision: Parts that score low on replaceability — long remake timelines, specialized processes, uncertain material availability — justify freight investments that reduce the probability of failure. This may mean selecting a carrier with higher on-time performance and documented freight handling protocols, choosing a mode with fewer terminal transfers, or adding declared value coverage that reflects the part's actual replacement cost rather than its weight. The incremental freight cost is almost always a fraction of the recovery cost the investment prevents.
Question 2: Is Delivery Tied to a Fixed-Schedule Event?
A fixed-schedule event is any downstream commitment where the delivery date is not a preference but a constraint. Installation windows with contractor crews on standby. Production launches with tooling changeover schedules that cannot be reversed. Government inspections with filing deadlines. Trade show displays with booth setup cutoffs. Customer acceptance testing with auditor availability.
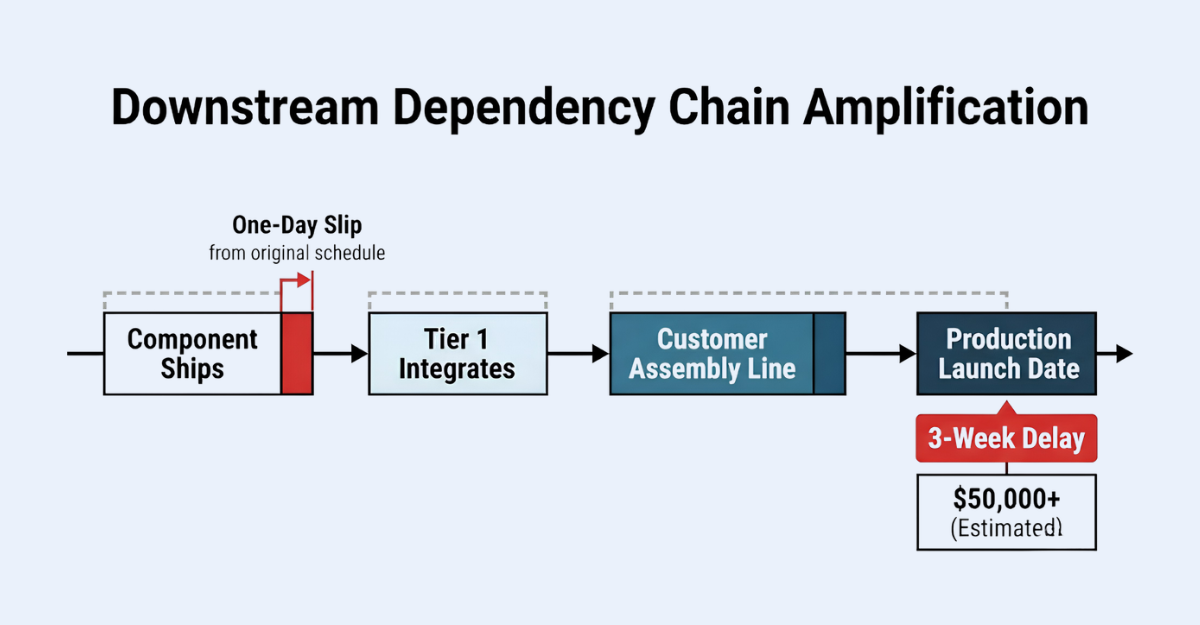
When delivery is tied to a fixed-schedule event, the cost of a one-day delay is not one day of inconvenience. It is whatever the fixed-schedule event costs to reschedule — which may be weeks of calendar time, thousands of dollars in standby charges, or permanent loss of the window entirely.
Many manufacturers underestimate how frequently their shipments are tied to fixed-schedule events because the connection is indirect. The machined component ships to a Tier 1 supplier, who integrates it into a subassembly, which feeds a customer's production line that has a launch date. The machine shop may not be aware that its delivery window is rigid — until the phone rings after the shipment arrives late.
What this means for the freight decision: Shipments tied to fixed-schedule events are mission-critical freight by definition, regardless of the part's dollar value. A $200 machined pin that gates a $2 million installation is mission-critical freight. The freight plan for these shipments should include proactive status communication, contingency routing, and a carrier with demonstrated ability to intervene when exceptions develop — not just a carrier with a competitive rate.
Question 3: How Many Carrier Touches Does This Shipment Involve?
Every time a shipment is handled — loaded onto a trailer, unloaded at a terminal, cross-docked to another trailer, transferred between carriers — the probability of damage or delay increases. This is not a quality judgment about any individual carrier or terminal. It is physics. Each handling event introduces mechanical stress to the freight and a scheduling dependency into the transit plan.
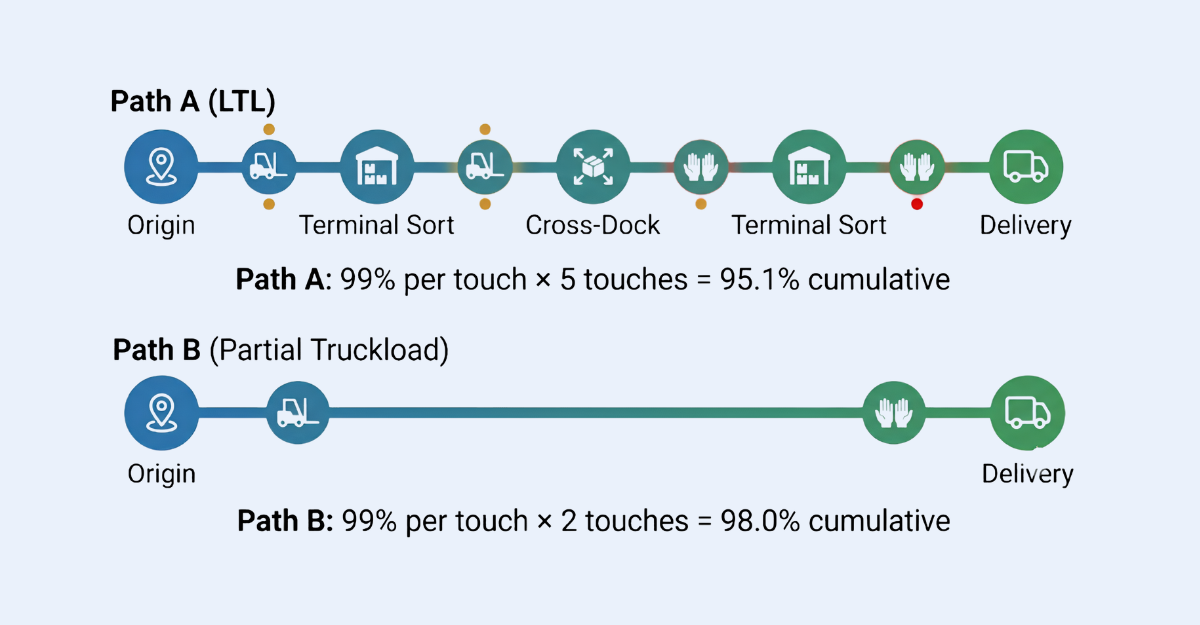
Standard LTL freight typically involves a minimum of four handling events: pickup, origin terminal sort, destination terminal sort, and final delivery. Multi-stop LTL shipments or shipments crossing carrier networks may involve six or more touches. Each touch point is both a damage risk and a potential scheduling bottleneck — a shipment that misses its cross-dock window at 11 PM does not get the next available truck. It waits for the next scheduled dispatch on that lane, which may be 24 hours later.
For precision manufactured parts — particularly components with tight dimensional tolerances, surface finish requirements, or fragile geometries — each additional handling event represents a compounding risk. A part that survives four touches with a 99 percent probability per touch has a cumulative survival probability of 96 percent. At six touches, that drops to 94 percent. Those numbers sound acceptable until the failure happens on a $15,000 irreplaceable component tied to a fixed-schedule installation.
What this means for the freight decision: Shipments with high touch counts and high failure costs are candidates for reduced-touch modes. Partial truckload service — where the freight stays on a single trailer from origin to destination without terminal transfers — eliminates the handling events that drive LTL damage risk. For the highest-value or most fragile shipments, white glove delivery provides specialized handling from dock to installation point. The cost premium for reduced-touch service is typically 30 to 80 percent above standard LTL. The cost of a single handling failure on a high-value shipment typically exceeds that premium by a factor of five or more.
Question 4: If This Arrived Damaged, What Would Recovery Look Like?
This question forces a concrete visualization of the failure scenario rather than an abstract risk assessment. It moves the freight decision from "what is the probability of damage" — which most people underestimate — to "what happens to the operation if damage occurs" — which is specific, uncomfortable, and clarifying.
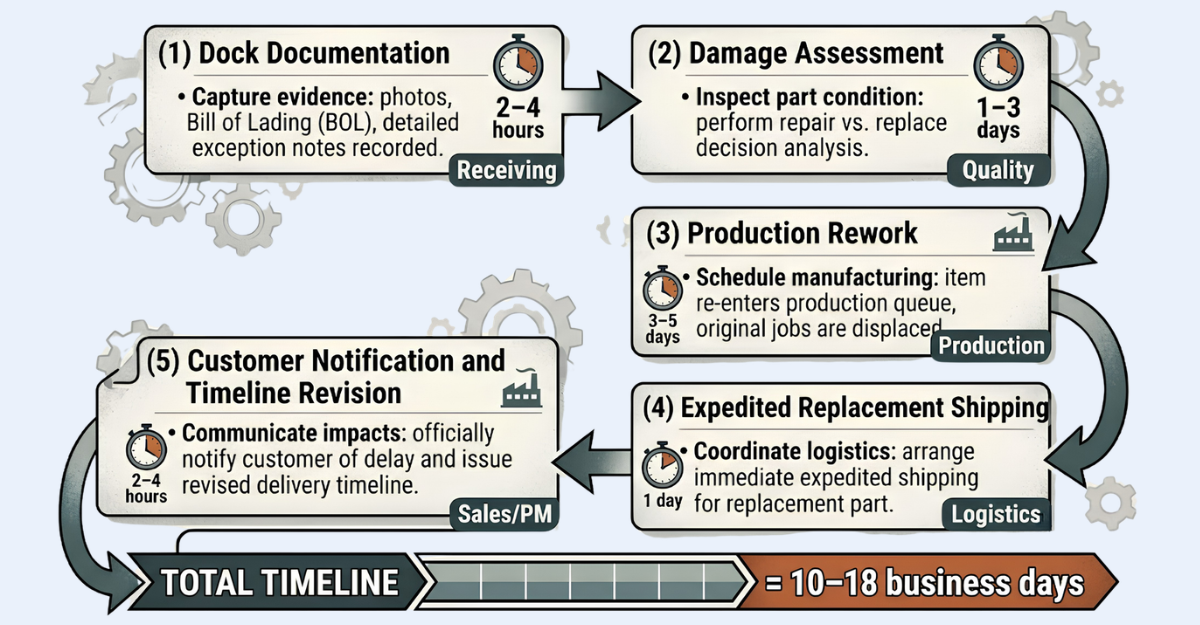
The recovery scenario for a damaged precision shipment typically includes several sequential steps, each with its own timeline and cost. First, the damage must be documented at the receiving dock — photographs, written exceptions on the delivery receipt, notification to the carrier. If this documentation is not completed properly at the time of delivery, the carrier liability claim may be compromised. Second, the part must be assessed to determine whether repair is possible or replacement is required. Third, if replacement is required, the production queue must accommodate the rework — displacing other orders or extending lead times. Fourth, the replacement part must ship, often on an expedited basis, adding a second freight cost. Fifth, the customer must be notified and the delivery commitment revised, with all the relationship costs that entails.
For manufacturers who have never walked through this sequence explicitly, the exercise is revelatory. The recovery from a single freight damage event on a critical shipment can consume 40 to 80 hours of professional time across shipping, production, quality, and customer-facing functions — before accounting for the production rework itself.
What this means for the freight decision: When the recovery scenario is severe — long replacement timelines, high production displacement, customer relationship exposure — the freight investment should include both prevention and insurance. Prevention means reduced handling, qualified carriers, and appropriate packaging. Insurance means declared value coverage that reflects the part's actual value and the downstream costs of failure, not the standard released-value terms that most LTL carriers include by default. A $5,000 precision component shipped under standard released-value terms may carry only $50 to $100 in carrier liability coverage. The gap between that coverage and the actual loss exposure is the manufacturer's uninsured risk.
Question 5: Who Needs to Know Immediately if Something Changes?
This is the communication question, and it is the one most frequently overlooked in freight planning. It shifts the focus from what the carrier does with the freight to what the carrier does with information about the freight — and for precision manufacturing shipments, the information is often more valuable than the freight speed.
When a shipment deviates from plan — a pickup is delayed, a transit milestone is missed, an ETA shifts — the value of that information decreases rapidly over time. A manufacturer who learns at 8 AM that a critical inbound shipment will arrive four hours late can rearrange the production schedule, reallocate machine time to other jobs, and notify the customer proactively. The same manufacturer who learns at 4 PM — after the production schedule has already been disrupted — can only react.
The notification list for a critical shipment is typically longer than shipping coordinators assume. It may include the production planner (for schedule adjustment), the quality team (if inspection windows are affected), the project manager (for customer communication), procurement (if alternative sourcing is needed), and occasionally the customer directly (if the customer's own operations depend on the delivery).
What this means for the freight decision: Carrier communication capability should be a weighted factor in carrier selection for precision freight, not an afterthought. An asset-based carrier with direct driver communication and proactive exception notification provides fundamentally different information flow than a brokered shipment where status updates depend on third-party tracking portals that refresh at terminal scan points. For shipments where the notification list includes more than two people, the freight plan should specify who gets notified, through what channel, and at what threshold of deviation. A carrier that delivers the freight on time is doing one job. A carrier that communicates proactively when things change is doing the job that actually matters.
How to Use the Scorecard
The five questions produce a cumulative risk profile that maps directly to freight mode and carrier decisions. In practice:
Low risk across all five questions — the part is replaceable, the schedule is flexible, touches are minimal, recovery is straightforward, and notification needs are simple — standard LTL at competitive rates is the appropriate decision. Overspending on premium service for genuinely low-risk freight is waste, and disciplined freight management means accepting commodity service where the risk profile supports it. (For more on when standard service is the right call, see Know When to Say No: Brand Integrity in Freight.)
Elevated risk on one or two questions — a moderately valuable part with a fixed delivery window, for example — may warrant a carrier upgrade (better on-time performance, proactive communication) without necessarily changing the shipping mode. The marginal cost of a higher-performing LTL carrier versus a bottom-rate option is often $40 to $80 per shipment. On a $5,000 part tied to a customer commitment, that is rounding error.
Elevated risk on three or more questions — an irreplaceable part, tied to a fixed schedule, moving through multiple carrier touches, with a severe recovery scenario and a complex notification list — requires a fundamentally different approach. This is freight that belongs in a partial truckload, expedited, or white glove mode with a carrier that has demonstrated capability in precision manufacturing logistics. The cost difference between standard LTL and a reduced-touch mode is the cheapest insurance a manufacturer can buy.
The Scorecard in Practice: Two Scenarios
Scenario A: Where the Scorecard Prevents a Failure
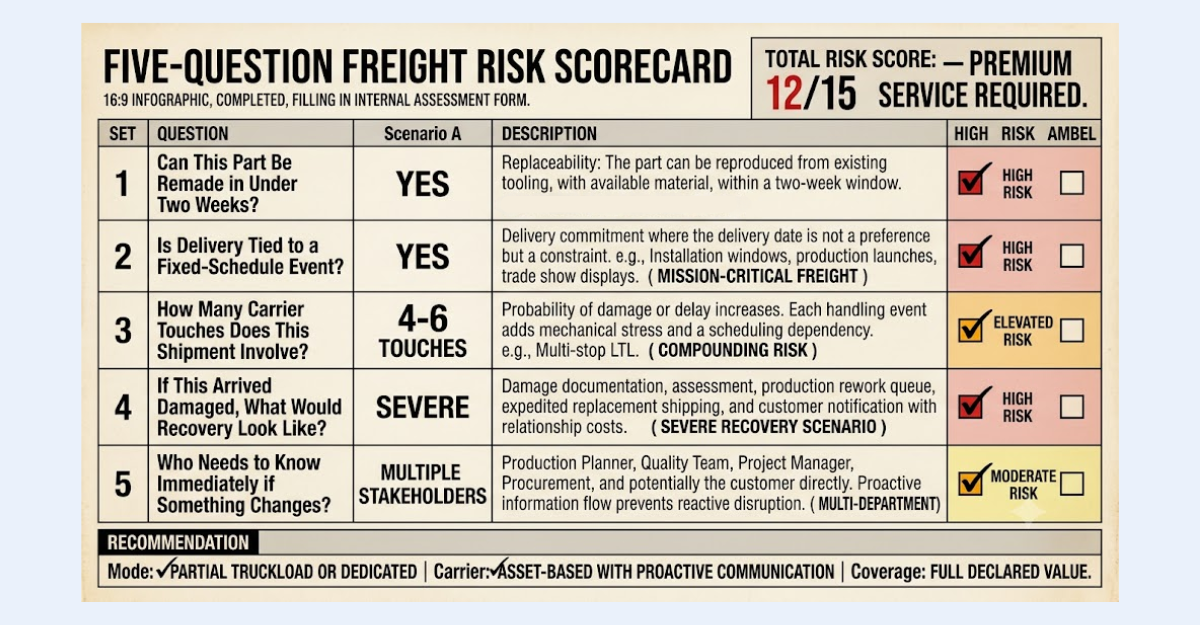
A tooling manufacturer finishes a custom injection mold component — one of three pieces needed for a mold assembly that a Tier 1 automotive supplier needs for a production launch in nine days. Running the scorecard:
The part cannot be remade in under two weeks (Question 1: high risk — the tooling steel has a three-week mill lead time). Delivery is tied to a fixed-schedule event (Question 2: high risk — the mold assembly must be complete for production validation seven days from now). The default LTL option involves five handling events across two carrier networks (Question 3: elevated risk). If the part arrived damaged, recovery would require emergency sourcing of specialty steel and displacing two other jobs on the wire EDM machine (Question 4: severe). The notification list includes the production planner, the mold shop foreman, the customer's program manager, and the customer's quality director (Question 5: complex).
The scorecard result is unambiguous. This shipment requires partial truckload or dedicated service with a single driver, no terminal transfers, proactive GPS tracking, and a carrier communication protocol that includes pre-delivery confirmation calls. The incremental cost over standard LTL — perhaps $600 to $900 — is not an expense. It is the cost of certainty on a shipment where failure would generate $25,000 or more in downstream consequences.
Scenario B: Where the Scorecard Prevents Overspending
The same manufacturer ships a batch of replacement wear plates — standard A2 tool steel, off-the-shelf dimensions, destined for a customer's maintenance inventory. Running the scorecard:
The parts can be remade in two days from shelf stock (Question 1: low risk). Delivery is flexible within a two-week window (Question 2: low risk). Standard LTL with three touches is fine — the parts are robust, well-packaged, and dimensionally simple (Question 3: low risk). If they arrived damaged, replacement would be straightforward and inexpensive (Question 4: manageable). The notification list is the customer's purchasing coordinator, by email, if the ETA shifts by more than two days (Question 5: simple).
The scorecard result is equally clear. This is standard LTL freight. Spending an extra $600 on partial truckload service would be waste — the failure cost does not justify the prevention investment. Disciplined freight management means matching service to risk in both directions.
Building the Scorecard Into Operations
The value of the scorecard multiplies when it moves from an individual shipping coordinator's judgment call to an institutional decision framework. Three implementation steps make this transition:
Step 1: Print it and post it. The five questions should be visible at the shipping dock, in the production planning area, and wherever freight decisions are made. Laminate it. Tape it to the wall next to the rate board. The goal is to make the risk assessment as automatic and reflexive as the rate comparison already is. Ninety seconds of assessment before booking a shipment can prevent days of recovery after a failure.
Step 2: Score it numerically. Assign each question a 1-3 scale (1 = low risk, 2 = moderate, 3 = high). A total score of 5-7 maps to standard service. A score of 8-11 maps to carrier upgrade or mode change. A score of 12-15 maps to premium or dedicated service. The numeric scoring removes subjectivity and creates a documented decision trail that can be reviewed and calibrated over time.
Step 3: Review it monthly. Compare freight failure events against the scorecard assessments that preceded them. When a failure occurs on a shipment that scored low on the risk assessment, the scorecard needs calibration. When a failure occurs on a shipment that scored high but was shipped on commodity service because of budget pressure, the conversation shifts from "why did this fail" to "why did we ignore the risk assessment." Both conversations are productive. Neither happens without the scorecard.
The manufacturing logistics partners that generate the most value for precision manufacturers are the ones that build this kind of risk-based decision framework into the relationship — not as a theoretical recommendation, but as a working tool that shapes every shipment decision.
Frequently Asked Questions
What is a freight risk scorecard? A freight risk scorecard is a structured assessment that evaluates the downstream cost exposure of a shipment before selecting a carrier or shipping mode. The five-question version presented here evaluates replaceability, schedule dependency, handling touches, damage recovery severity, and notification complexity. The resulting risk profile maps directly to freight mode and carrier decisions, replacing rate-only decision-making with risk-adjusted freight management.
How do manufacturers assess shipping risk for precision parts? Precision parts carry freight risk that extends beyond the part's dollar value. The assessment should account for how long the part takes to remake, whether delivery is tied to a fixed-schedule event, how many times the freight is handled in transit, what recovery looks like if the part arrives damaged, and who needs immediate notification if something changes. Each factor independently influences whether standard LTL, partial truckload, or dedicated service is the appropriate mode.
When should a manufacturer use partial truckload instead of LTL? When the freight risk scorecard shows elevated risk on three or more dimensions — particularly when the part is irreplaceable, the schedule is fixed, and the shipment involves multiple terminal transfers — partial truckload service eliminates the handling events that drive LTL damage risk. The cost premium is typically 30 to 80 percent above LTL, while the cost of a single LTL failure on high-risk freight routinely exceeds 5 to 10 times that premium.
What is carrier liability for precision manufactured parts? Most LTL carriers limit liability based on weight, not value. Under standard released-value terms, a $5,000 precision component weighing 80 pounds may carry $50 to $100 in coverage. Manufacturers shipping high-value parts should either declare full value (which adds to the freight cost) or obtain separate cargo insurance that covers the actual replacement cost and downstream losses.
How does the scorecard reduce emergency expedite costs? Emergency expedite spending in manufacturing is frequently a symptom of freight decisions that did not account for risk. When a critical shipment moves on commodity service and fails, the recovery almost always involves expedited replacement shipping at 5 to 10 times the standard rate. The scorecard identifies which shipments carry this exposure before they move, allowing the manufacturer to invest in appropriate service upfront rather than paying the emergency premium after a failure.
other blog posts
%2520(3).webp)