Supply Chain Resilience in 2026: Tariffs, Tight Capacity, and the Freight Market Shippers Need to Navigate
72% of trade professionals cite U.S. tariff volatility as 2026's most impactful supply chain change. With spot rates above contract, tender rejections at 15%+, and 82% of supply chains affected by tariffs, here's what shippers need to know to build resilience into freight operations.
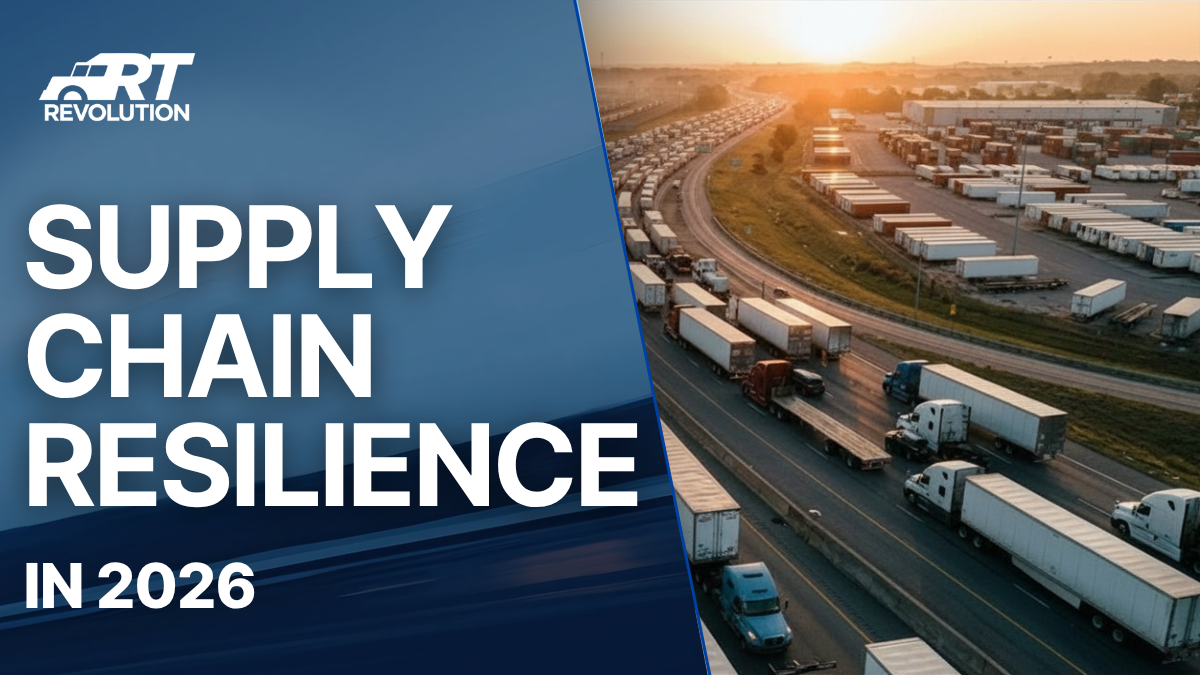
The 2026 freight market is doing something it has not done since 2021: spot truckload rates are running above contract rates. Tender rejection rates have climbed past 15 percent — the highest since early 2022. Dry van rates are 8 percent above 2025 levels year-over-year. Reefer is up 6 percent. Flatbed has reached a record high.
These are not demand-cycle numbers. The freight market is tightening from both sides simultaneously: demand is shifting under tariff-driven supply chain restructuring, and capacity is contracting under regulatory pressure, insurance cost escalation, and carrier exits. The result is a market that punishes reactive planning and rewards shippers who have built resilience into their freight operations before the disruption arrives.
This article maps the forces shaping the 2026 freight environment — tariff volatility, capacity contraction, rate dynamics, and nearshoring trends — and outlines what shippers should be doing now to maintain service reliability and cost predictability.

The Tariff Environment: Scale and Speed of Change
The trade policy environment in 2026 is producing disruption at a velocity that supply chains are not structured to absorb. A 2026 survey by the National Council on International Trade found that 72 percent of trade professionals cite U.S. tariff volatility as the most impactful change affecting their operations — up from 41 percent in 2024. McKinsey's Q1 2026 supply chain survey reported that 82 percent of supply chain leaders said their supply chains had been directly affected by tariff changes.
The specific tariff structures matter less for this analysis than the behavioral response they are generating. When tariff schedules change quarterly — or are announced, delayed, modified, and sometimes reversed — businesses cannot plan around a stable cost structure. They hedge. They front-load inventory. They reroute sourcing. They renegotiate contracts with shorter duration windows. Every one of these hedging behaviors produces freight demand that does not follow traditional seasonal patterns.
Pre-tariff Inventory Surges
The most immediate freight impact of tariff volatility is the pre-tariff inventory surge. When a tariff increase is announced with a 30- or 60-day implementation window, importers accelerate inbound shipments to clear goods at the lower rate. The result is a freight demand spike that compresses several months of normal import volume into weeks.
These surges overwhelm port capacity, drayage networks, and inland transportation simultaneously. Warehouses fill. Intermodal capacity tightens. LTL terminals see volume spikes that exceed their handling capacity. The carriers and modes that absorb the surge are unavailable for other freight — creating cascading capacity shortfalls for shippers whose freight has nothing to do with the tariff in question.
For shippers moving domestic freight, the pre-tariff surge is a secondary effect that is easy to miss in planning but impossible to miss in execution. A manufacturer shipping finished goods from Ohio to Texas discovers that available truckload capacity on that lane has tightened — not because their freight market changed, but because the import surge into Houston is consuming available trucks.

Sourcing Shifts and New Freight Patterns
Beyond the immediate inventory effects, tariff volatility is driving longer-term sourcing decisions that are redrawing freight patterns across North America. McKinsey's survey found that 65 percent of supply chain leaders are changing sourcing origins, 57 percent are renegotiating supplier contracts, and 51 percent are actively pursuing nearshoring strategies. Forty-three percent plan to shift some portion of their supply chain to the United States over the next three years.
These are not minor adjustments. When a manufacturer moves component sourcing from East Asia to Mexico, the entire transportation mode and lane structure changes. What was an ocean container into LA/Long Beach followed by rail to the Midwest becomes a cross-border truck movement through Laredo or El Paso. The freight does not disappear — it reshapes. And the lanes that receive the redirected volume tighten, while the carriers and infrastructure that served the prior routing lose volume.
Mexico now accounts for 16.3 percent of total U.S. trade — a figure that has been climbing steadily and is projected to continue rising as nearshoring accelerates. The cross-border freight corridors serving this trade are already experiencing capacity constraints, and the infrastructure (border crossing capacity, drayage availability, bonded warehouse space) has not expanded at the rate of trade growth.
Capacity Contraction: The Supply Side Is Tightening
The demand-side disruption from tariffs is colliding with a supply side that is contracting independently. Multiple concurrent forces are removing capacity from the market:

Carrier Exits
The carrier population has been shrinking since late 2023 as operators that entered the market during the pandemic freight boom have exited under margin pressure. Fuel costs, equipment depreciation, and insurance premiums have compressed margins for small and mid-size carriers to the point where operating is no longer economically viable. The carriers exiting are disproportionately small operators — single-truck owner-operators and fleets of 10 to 50 trucks — that provide local and regional capacity in markets that larger carriers do not always serve.
Regulatory Pressure
FMCSA's non-domiciled CDL rule, effective March 2026, restricts CDL eligibility for approximately 194,000 drivers who do not hold qualifying visa categories. The licenses phase out as they reach expiration, creating a rolling capacity contraction that will remove tens of thousands of drivers from the available pool over the next 12 to 36 months. The impact is concentrated in port drayage, construction hauling, and regional delivery — segments where non-domiciled CDL holders are disproportionately represented.
Insurance Cost Escalation
The nuclear verdict crisis has pushed trucking insurance premiums to record levels. ATRI's 2025 Operational Costs of Trucking report recorded $0.102 per mile in insurance costs — the highest on record. Premiums have increased an average of 8.3 percent annually since 2017, with small and mid-size fleets absorbing 15 to 20 percent annual increases. Some insurers have exited the trucking market entirely. For carriers operating on 3 to 8 percent margins, insurance cost increases of this magnitude are the difference between continued operation and closure.
The Combined Effect
No single one of these forces would produce the capacity environment that exists in 2026. It is the combination that matters. Tariff-driven demand shifts are creating new freight patterns and volume surges at the same time that carrier exits, regulatory changes, and insurance costs are removing capacity. The market is tightening from both sides, and the tightening is structural — it will not reverse when freight demand softens, because the supply-side contraction is driven by factors that are independent of demand.
.png)
What the Rate Data Is Telling Shippers
The rate environment in 2026 confirms the structural tightening thesis:
Spot rates above contract. For the first time since 2021, spot truckload rates are consistently running above contract rates. In a balanced or over-supplied market, spot rates trade below contract because excess capacity is available at a discount. When spot exceeds contract, it signals that carriers can earn more on the open market than committed freight pays — which means committed capacity is at risk of defection. Shippers with contract rates that were negotiated during the soft market of 2023-2024 may find that their contracted carriers are less reliable than expected, because the carrier can earn more by covering spot freight.
Tender rejections at 15+ percent. The tender rejection rate — the percentage of contracted freight loads that carriers decline to haul — has climbed above 15 percent nationally, the highest since early 2022. A 15 percent rejection rate means that roughly one in seven loads that a shipper tenders to their contracted carrier is declined. The shipper must then find alternative capacity, typically at a higher cost and with less certainty of service.
Mode-specific dynamics. Dry van rates are 8 percent above 2025 year-over-year. Reefer is up 6 percent. Flatbed has reached record pricing, driven in part by construction and infrastructure spending. These are not uniform increases — they reflect mode-specific capacity constraints that vary by geography, season, and freight type.
For shippers accustomed to building freight budgets on the assumption that 2023-2024 rate levels represent the baseline, the 2026 market is a correction. The baseline has moved. Shippers planning 2027 budgets on 2024 rates are building on a floor that no longer exists.
Building Resilience: What Shippers Should Be Doing
Supply chain resilience is not a strategy that can be implemented after the disruption arrives. It is a set of structural decisions about carrier relationships, freight planning, mode flexibility, and operational buffers that must be in place before they are needed. The following practices separate shippers who navigate the 2026 market effectively from those who are continuously reacting to disruptions they did not anticipate.
Diversify Carrier Relationships Beyond Rate
A shipper whose carrier selection process optimizes exclusively for rate is a shipper who has optimized for a market that no longer exists. In a tight capacity market, the carriers that perform are the ones with operational discipline, documented safety programs, and the financial stability to maintain service levels when market conditions shift.
The distinction between an asset-based carrier and a freight broker becomes most visible in a tight market. Brokers depend on carrier networks that are subject to the same capacity constraints affecting the entire market. An asset-based carrier that owns and operates its own trucks, employs its own drivers, and controls its own maintenance and compliance infrastructure can commit capacity because it controls the assets — not because it is confident it can find a third party to provide them.
Shippers should evaluate whether their carrier mix includes carriers that will prioritize their freight when the market tightens. The carriers most likely to maintain service reliability are those with whom the shipper has a relationship that extends beyond transactional load-by-load pricing.
Build Lead Time Buffers
In a market where one in seven tendered loads is rejected, production schedules and delivery commitments that assume 100 percent first-tender acceptance are schedules built on false assumptions. Shippers should build 24 to 48 hours of lead time buffer into freight planning — not as contingency for exceptional events, but as standard operating practice for a market where capacity disruptions are routine.
The cost of a lead time buffer is measured in inventory carrying costs and production scheduling flexibility. The cost of not having one is measured in expedited freight charges — which can run 2x to 5x the cost of standard transit — and in the downstream consequences of late deliveries to customers whose own production schedules depend on the arrival.
Evaluate Mode Flexibility
Not every shipment must move by the same mode every time. Shippers who have the flexibility to shift between LTL, partial truckload, and full truckload based on capacity availability and cost can navigate tightening in one mode by shifting volume to another. The key is that mode flexibility must be designed into the freight program — carrier relationships, shipping dock capabilities, and packaging standards must accommodate multiple modes — rather than improvised under pressure.
For freight where mode selection must account for value, fragility, or schedule criticality, the freight risk assessment should be performed proactively rather than at the moment of shipping. A shipper who has already determined which freight is flexible (can shift modes or absorb transit time variation) and which is rigid (must move by a specific mode on a specific schedule) can make faster capacity decisions when the market tightens.
Strengthen Cross-Border Freight Partnerships
For shippers whose supply chains include Mexico-origin freight — a population that is growing as nearshoring accelerates — the cross-border logistics capability of their carrier network is a critical evaluation criterion. Cross-border freight requires customs brokerage coordination, border-crossing scheduling, bonded carrier authority, and visibility across the handoff from Mexican carrier to U.S. carrier (or a single carrier with cross-border authority).
Carriers with established cross-border operations, documented customs processes, and reliable transit times through congested border crossings provide a level of certainty that ad hoc cross-border arrangements cannot match. As Mexico's share of U.S. trade continues to grow, the gap between shippers with strong cross-border freight partnerships and those without will widen.

Know Your True Cost of Service
The headline rate per mile or per hundredweight is one data point. The true cost of service includes accessorial charges, detention and demurrage costs, claims frequency, on-time performance, and the operational cost of managing carrier failures. A carrier quoting $2.50 per mile with a 92 percent on-time rate and a 3 percent claims rate may be less expensive than a carrier quoting $2.20 per mile with an 85 percent on-time rate and an 8 percent claims rate — once the cost of managing exceptions, rebooking failed loads, and absorbing detention charges is calculated.
In a tight market, the gap between headline cost and true cost widens because the consequence of service failures becomes more expensive. A failed load in a soft market can be reboked at a similar rate. A failed load in a tight market may require spot market coverage at a premium, or expedited service at a multiple, or — worst case — a production stoppage that costs orders of magnitude more than the freight itself.
The Nearshoring Opportunity and Its Freight Implications
The supply chain restructuring underway in 2026 is not purely defensive. Nearshoring — relocating production and sourcing closer to the point of consumption — is a strategic decision that many manufacturers and distributors are making to reduce tariff exposure, shorten supply chains, and improve responsiveness.
Forty-three percent of supply chain leaders plan to shift some supply chain operations to the United States over the next three years. Sixty-five percent are changing sourcing origins. The manufacturing base in northern Mexico continues to expand, and the logistics infrastructure connecting Mexican production to U.S. distribution is a growth corridor for the freight industry.
For shippers, the nearshoring trend presents both opportunity and operational complexity. Shorter supply chains mean shorter transit times, lower inventory carrying requirements, and reduced exposure to ocean freight disruptions. But they also mean new lane structures, new carrier relationships, and new compliance requirements (customs, cross-border documentation, CTPAT certification) that must be operationalized.
The shippers who capture the benefit of nearshoring are those who treat the freight transition as a parallel workstream to the sourcing transition. A sourcing decision that moves component supply from Shanghai to Monterrey is incomplete without a freight strategy that ensures the components move reliably from Monterrey to the production facility. The freight strategy requires carrier evaluation, lane analysis, border-crossing performance data, and — in many cases — a carrier partner with the operational infrastructure to handle high-consequence freight across the border.

What to Expect for the Rest of 2026 and Into 2027
The structural dynamics driving the current market are not cyclical, and they are not resolving in the near term:
The tariff environment is producing ongoing sourcing shifts and inventory management changes that will continue to generate non-seasonal freight demand patterns. Even if specific tariff schedules stabilize, the behavioral response — diversified sourcing, nearshoring, shortened contract cycles — is durable.
The capacity contraction from carrier exits, the CDL rule, and insurance cost escalation will continue through 2027. The CDL rule's impact is paced by license expiration dates spread over the next 12 to 36 months. Insurance premiums are forecast to increase 8 to 15 percent in 2026, continuing the pressure on carrier margins. Carrier exits have not plateaued.
Rate pressure will persist. Shippers budgeting for 2027 should model scenarios where rates are 5 to 12 percent above current levels, not because any single factor produces that increase, but because the combination of demand shifts and supply contraction creates sustained upward pressure that historical precedent — grounded in demand-cycle analysis — underestimates.
The shippers who will navigate this environment most effectively are those who have made carrier relationship quality, mode flexibility, lead time buffers, and freight exception management structural features of their freight programs rather than reactive responses to individual disruptions.
Frequently Asked Questions
Why are freight rates increasing in 2026? The 2026 freight market is tightening from both sides simultaneously. Tariff-driven supply chain restructuring is creating demand surges and new freight patterns, while carrier exits, FMCSA's non-domiciled CDL rule (affecting ~194,000 drivers), and record insurance costs ($0.102/mile) are contracting supply. Spot truckload rates have moved above contract rates for the first time since 2021, and tender rejections exceed 15 percent nationally.
How are tariffs affecting supply chains in 2026? Seventy-two percent of trade professionals cite U.S. tariff volatility as the most impactful change to their operations, up from 41 percent in 2024. Eighty-two percent of supply chain leaders report direct tariff impacts. The response includes pre-tariff inventory surges that create freight demand spikes, sourcing shifts to new origins, and accelerated nearshoring — all of which are redrawing freight patterns and creating capacity pressure on lanes that were previously balanced.
What is the impact of nearshoring on U.S. freight? Mexico now accounts for 16.3 percent of total U.S. trade, and 43 percent of supply chain leaders plan to shift operations to the U.S. over the next three years. Nearshoring reduces ocean transit times and tariff exposure but creates new demand on cross-border trucking corridors that are already capacity-constrained. Shippers pursuing nearshoring strategies need carrier partners with established cross-border operations and customs coordination capabilities.
How can shippers build supply chain resilience? Five structural practices: diversify carrier relationships beyond rate to include service reliability and financial stability; build 24-48 hours of lead time buffer into standard freight planning; design mode flexibility into the freight program (LTL, partial, truckload); know the true cost of service including accessorials, claims, and exception costs; and establish carrier partnerships that prioritize your freight when capacity tightens.
What should shippers expect for freight rates in 2027? The structural forces driving the current market — tariff-induced demand shifts, carrier exits, regulatory capacity contraction, and insurance cost escalation — are not resolving in the near term. Shippers budgeting for 2027 should model scenarios where rates are 5 to 12 percent above current 2026 levels. Planning based on 2023-2024 rate levels will underestimate the actual cost environment.
How do carrier exits affect freight availability? Carrier exits remove trucks from the available capacity pool, concentrating the impact in local and regional markets where small operators (1-50 trucks) provide the most capacity. The carriers exiting are under pressure from insurance costs, fuel, equipment depreciation, and thin margins. Each exit reduces lane-level competition and contributes to the tender rejection rates (now 15+ percent) that force shippers to seek alternative — and typically more expensive — capacity.
other blog posts
%2520(1).webp)
%2520(1).webp)

.webp)
.png)
%2520(3).webp)